Phase coverage#
Given a certain period, nightshift can be used to compute how much of an orbit is covered by certain observations.
Simulating some data#
We start by simulating some observed times, but of course you can use your own observation times.
import numpy as np

length = 4/24 # the length (in hours) of a single observation
days = 20 # the number of observations
exposure = 20/60/24 # exposure of an observation

# we observe `length` hours every day for `days` days
times = np.hstack([np.arange(0, length, exposure) + i for i in np.arange(days)])
Computing the phase coverage#
We would then like to compute the coverage for a range of periods
from nightshift import coverage

periods = np.linspace(0.1, 10, 2000) # in days
covered = coverage(times, periods)
let’s plot the results
import matplotlib.pyplot as plt

plt.subplot(111, xlabel="periods", ylabel="coverage")
plt.plot(periods, covered, c="0.5")
[<matplotlib.lines.Line2D at 0x7fb8f725c400>]
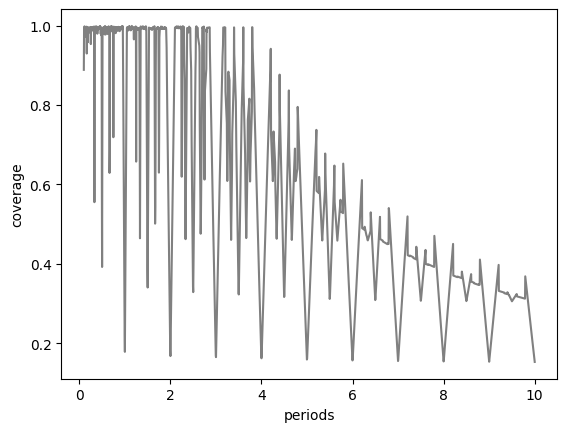
coverage of 1. means a period that has been fully covered. For this particular simulation (4 hours per night observations) the minima corresponds to the day/night cycle.
Application#
nightshift is particularly useful to understand how much a periodic orbit is covered by certain observations. It can be used to know if a planet with a certain orbital period was susceptible to be observed or not. If \(c\) is the coverage at a certain period \(P\), of particular interest is the quantity
which corresponds to how much orbits with periods up to \(P\) have been observed given certain observation times.
Note
Keep in mind that phase coverage is a mean quantity, and that actual phase coverage highly depend on the phase of an event during its orbit (such as the transit mid-time for a transiting exoplanet)